Debugging a Session
How to open DevTools for a browser
You can access the remote browser’s DevTools via a Live View. Here you’ll be able to inspect a page, network requests, console logs, cookies, and much more.
Load the debugger
First you’ll need to create a session and get a Live View URL with the includeNavigationBar parameter set to true. Load the url in your browser.
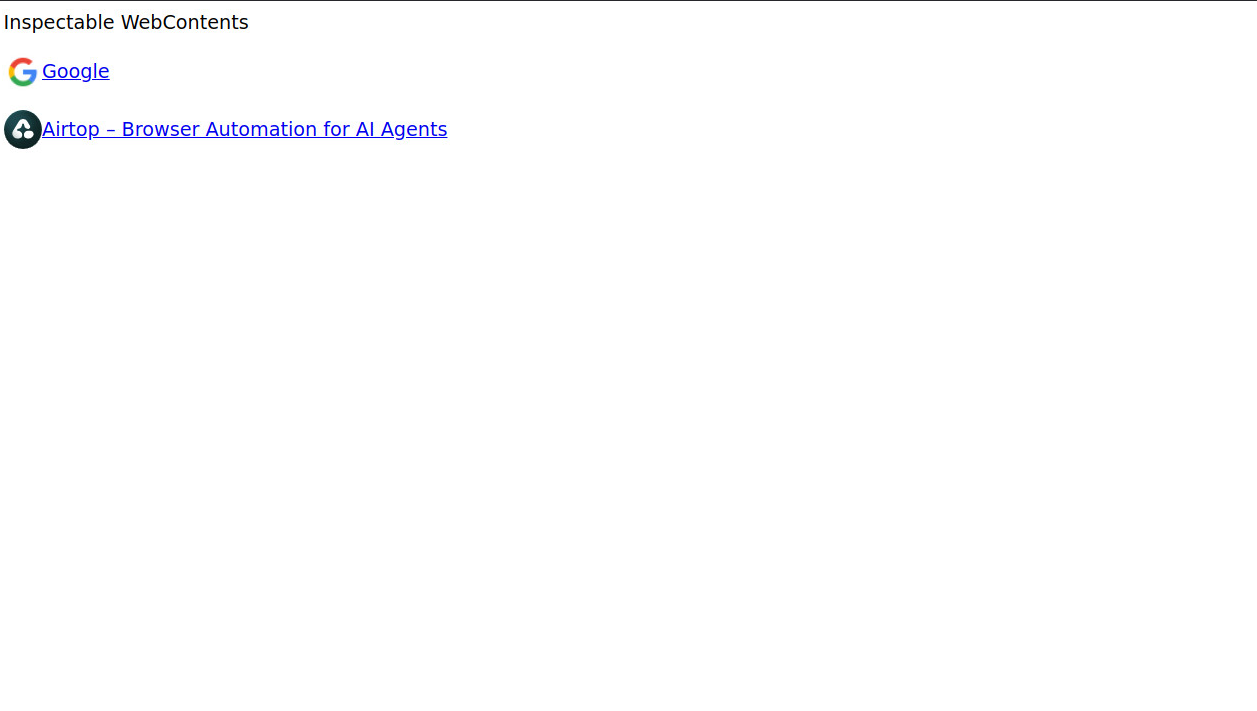
In the navigation bar inside the Live View, enter debugger in the url field and press enter.

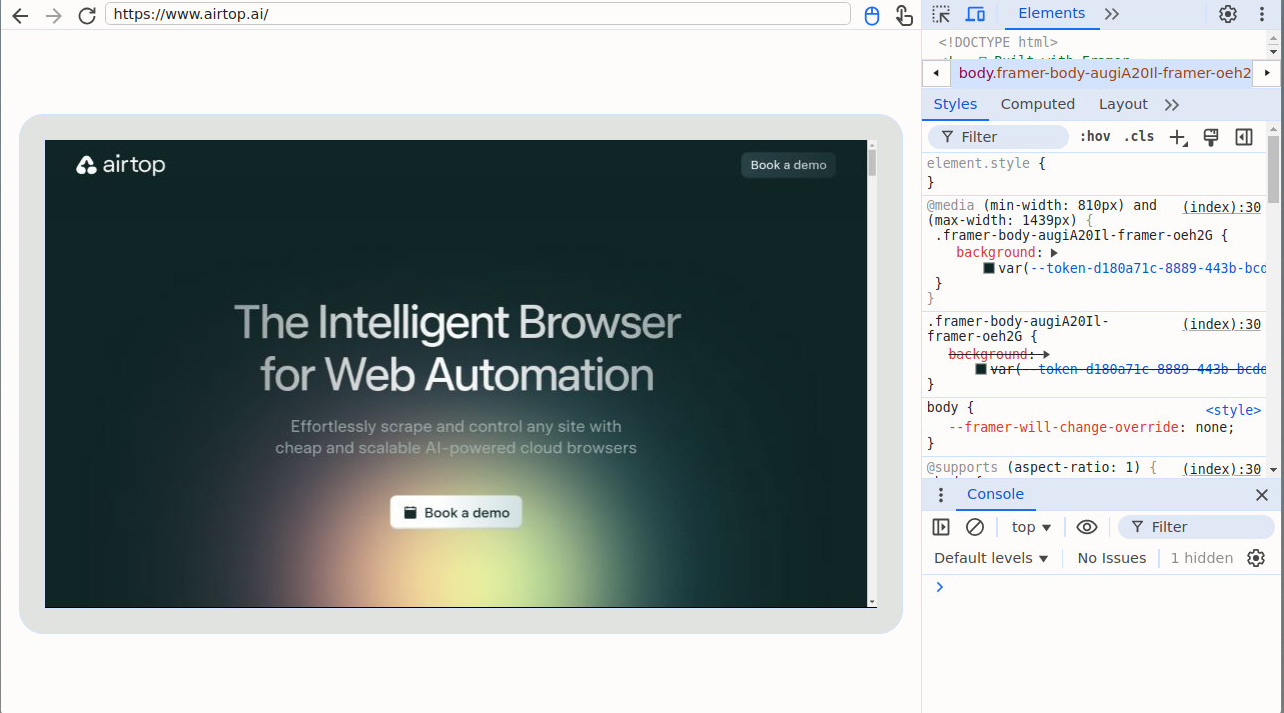
This will load the DevTools page selector where you can select the window you want to inspect.
Once you select a page, the DevTools will connect to the browser and you’ll be able to inspect the page.